


With earnings season well underway, Jim Cramer wanted to remind investors of a crucial piece of advice as the results pour in: do not overthink this stock market.
For example, when United Technologies issued a strong earnings report, its stock still went down. Chalking it up to earnings season confusion, the "Mad Money" host said the action provided a buying opportunity rather than a genuine take on the aircraft manufacturer's quarter.
To help explain this irrationality, Cramer turned to technician Tim Collins, his colleague at RealMoney.com, who said one defense stock could provide investors with a similar opportunity.
"Collins thinks we could potentially be seeing something very similar from GD, General Dynamics, the big defense contractor, after it reports [Wednesday]," Cramer said. "If General Dynamics gives you a nice beat and maintains its guidance but the stock goes down, which it would, by the way, then you might just be getting a wonderful gift."
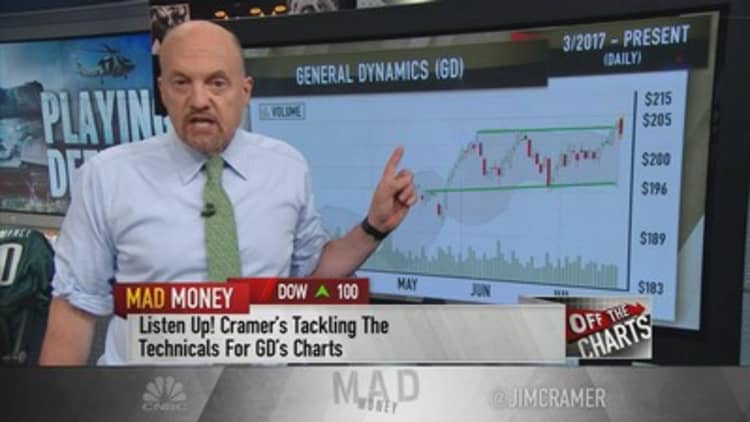
Cramer began with General Dynamics' daily chart. Collins said the stock, which trades at roughly $203 a share, seems to be approaching its $205 ceiling of resistance.
"If the stock can rally up a buck and a half from here, it will have broken out," Cramer said. "If that happens, Collins would be a strong buyer, because that kind of breakout typically means that a stock has much more room to run."
The stock has also pushed above the colored-in gray area on its chart, also known as its upper Bollinger Band, a technical tool that measures volatility levels in a given stock. Collins said that was a very bullish move because the last two times the stock traded above that band, it continued to soar higher.
If the defense contractor's breakout is jeopardized by Wall Street's reaction to its earnings report, Collins said the stock would continue to trade in a range of $196 to $204, with potential downside targets at $200 and $196. If it manages to break out, he could see it running to $215.
For a longer term view, Collins also consulted General Dynamics' weekly chart, which Cramer called "a textbook example of a bullish chart."
On a steady run higher, the stock has provided bountiful opportunities for traders who have bought it on its dips and sold at its peaks, Cramer said.
General Dynamics' weekly chart shows a floor of support at $200 and another at $196, according to the purple area on the chart. That is known as the Chandelier Exit, an indicator that tells technicians when to sell a stock based on its trading range.
"In short, Collins says that as long as the stock continues to hold above $196, there's no reason not to own General Dynamics," Cramer said.
Considering the weekly chart's two other indicators, both of which are sending Collins "buy" signals, the technician could see General Dynamics' stock trading up to $230 in the next year.
"Here's the bottom line: in this crazy week that's overflowing with earnings, I find these charts to be good touchstones that can try to help you navigate your way through potentially confusing situations," Cramer said. "We're going to hear from GD tomorrow, and the charts, as interpreted by Tim Collins, suggest this defense stock could have a lot more room to run with minimal downside. So if General Dynamics reports a good quarter and its stock gets slammed anyway like United Technologies, that's all the more reason to treat the weakness as a buying opportunity for this, the highest quality defense stock there is."
Watch the full segment: Off the charts with General Dynamics
Questions for Cramer?
Call Cramer: 1-800-743-CNBC
Want to take a deep dive into Cramer's world? Hit him up!
Mad Money Twitter - Jim Cramer Twitter - Facebook - Instagram - Vine
Questions, comments, suggestions for the "Mad Money" website? madcap@cnbc.com