


Recent sell-offs in the market means investors should be cautious, said CNBC's Mad Money host Jim Cramer.
On Tuesday, the yield on the benchmark ten-year treasury was briefly above 3 percent. Even a healthy earnings cycle couldn't stop the market from plunging the same day.
"Given how many people on Wall Street take their cue from this stuff, I think you need to be aware of these key levels in case we breach them in either direction," Cramer said.
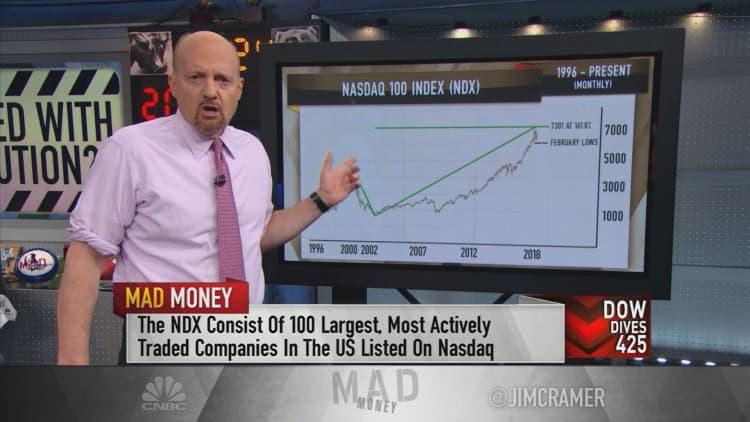
To help understand what's happening, Cramer enlists the help of Carolyn Boroden. The duo analyzed the Nasdaq 100, which is made up of 100 of the largest non-financial stocks in the tech-heavy Nasdaq Composite, and the S&P 500 Cash Index .
"Down a few percent from these levels both indices become a lot uglier," Cramer said Tuesday. "Up a few percent and they start looking real pretty."
But Cramer said the current levels aren't the end of the world.
"Weakness like this could end up, not is, being a buying opportunity," Cramer said.
Boroden uses the prism of Fibonacci ratios, a series of numbers discovered by the medieval godfather of mathematics, Leonardo Fibonacci. This helps her identify key levels where a security is more likely to change course.
While the Nasdaq 100 has experienced a series of recent declines, Boroden points out that rallies and declines tend to operate on similar scales.
In the four most recent declines, the Nasdaq 100 fell between 850 and 900 points before recovering, according to Boroden's analysis. The index fell by 863 points from its March peak, and Cramer said that might signal the worst is over.
Still, zooming in on the daily chart, Cramer said there are more reasons to be cautious.
"The Nasdaq 100's recent rally from the April 2 lows put it within striking distance of not one, not two, but three important Fibonacci levels," Cramer said. "In other words, last week's highs came right around where Boroden would expect a rally to run out of steam."
"Now, here's the problem: Boroden says that when you see a confluence of cycles like this, you need to anticipate a possible reversal of whatever the index was doing beforehand," he continued.
Before investors can start thinking bullish, a few things need to happen, Cramer said. First, the index needs to hold above the February lows of 6,164, and it also has to break out above last week's highs of around 6,856.
Cramer applies the same logic to the S&P 500 Cash Index: a 3 percent increase, up above 2,725 would put the index in good shape.
"From a technical perspective, the S&P is also balanced on a knife's edge,"' Cramer said. "Up 3 percent, we're in good shape, down 4 percent and in we're in for world of hurt."
WATCH: Cramer's charts flash potential warning signs
Questions for Cramer?
Call Cramer: 1-800-743-CNBC
Want to take a deep dive into Cramer's world? Hit him up!
Mad Money Twitter - Jim Cramer Twitter - Facebook - Instagram - Vine
Questions, comments, suggestions for the "Mad Money" website? madcap@cnbc.com