(Read more: The stock market's line in the sand—S&P 1,700)
To demonstrate, he cited research from SentimenTrader's Jason Goepfert, who has been warning about Hindenburg dangers all summer.
From his most recent findings:
Sometimes a topic in the market takes hold and it's hard to shake it off. One of those is the technical "market crash" signal called the Hindenburg Omen.
It has its boosters and its detractors, and we're not going to get caught up in debating its merits. We've discussed it for 12 years, always with the same arguments.
On June 10th, we outlined the market's historical performance after suffering at least 5 signals from the Hindenburg Omen within a two-week period. Stocks were consistently weak afterward, and proved to be so again, at least for a while.
With the latest market rally, the Omens are flaring up again.There have been 5 Omens triggered out of the past 8 trading sessions (your data may vary—we're using the same sources we've always used for historical data). That's actually the closest-grouped cluster since early November 2007.
It's extremely rare to see as many Omens occurring together as we've seen over the past 50 days. The last time was prior to the bear market in 2007.
The time before that was prior to the bear market in 2000.
The most commonly cited Hindenburg factor is when an unusually high number of stocks on the New York Stock Exchange hit 52-week highs and lows.
Others include when the NYSE index is higher than it was 50 days ago; when market breadth is negative, and when new highs are less than new lows. Traditional thinking is that all the indicators must occur on the same day, though interpretations vary.
(Read more: Why a 4 to 6 percent pullback may happen soon: Pros)
To be sure, the Hindenburg signals don't always work.
The most recent spate of Hindenburg chatter came May 31, and the S&P 500 is up nearly 4 percent since.
(Read more: The 'Hindenburg Omen': Bear signal scares market)
Yet the recurrence of signs still has trading floors buzzing.
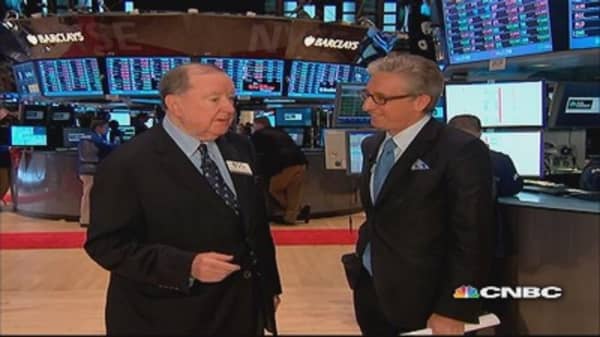
"Two precedents don't make a pattern," Cashin said, "but that sure makes that 'check engine' light glow much, much brighter."
—By CNBC's Jeff Cox. Follow him @JeffCoxCNBCcom on Twitter.


